- Analytics
- Technical Analysis
AUD/USD Technical Analysis - AUD/USD Trading: 2019-10-17
Lower unemployment bullish for AUDUSD
Unemployment in Australia dipped for the first time in seven months in September. Will the AUDUSD rise?
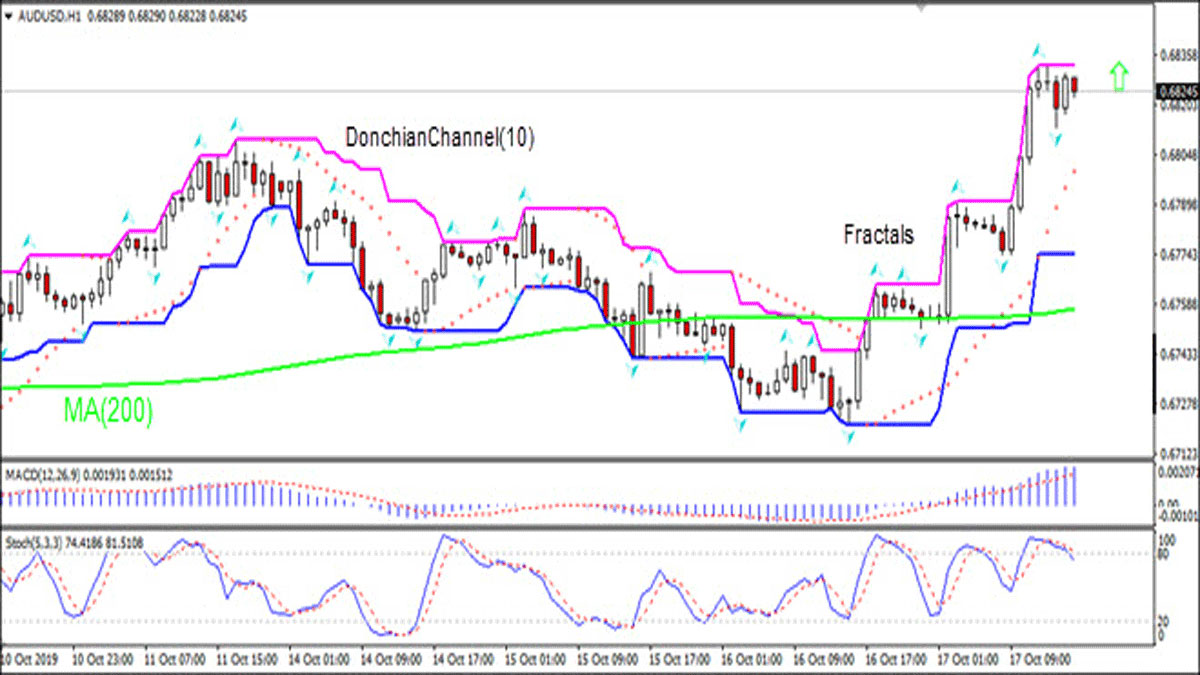
The price chart on 1-hour timeframe shows AUDUSD: H1 is in uptrend. The price is above the 200-period moving average MA(200) which is rising. The Stochastic oscillator is in the overbought zone which is bearish.
Technical Analysis Summary
| Order | Buy |
| Buy stop | Above 0.6832 |
| Stop loss | Below 0.6812 |
Explore our
Trading Conditions
- Spreads from 0.0 pip
- 30,000+ Trading Instruments
- Stop Out Level - Only 10%
Ready to Trade?
Open Account Note:
This overview has an informative and tutorial character and is published for free. All the data, included in the overview, are received from public sources, recognized as more or less reliable. Moreover, there is no guarantee that the indicated information is full and precise. Overviews are not updated. The whole information in each overview, including opinion, indicators, charts and anything else, is provided only for familiarization purposes and is not financial advice or а recommendation. The whole text and its any part, as well as the charts cannot be considered as an offer to make a deal with any asset. IFC Markets and its employees under any circumstances are not liable for any action taken by someone else during or after reading the overview.
