- Analytics
- Technical Analysis
Arabica Coffee Technical Analysis - Arabica Coffee Trading: 2017-11-06
Weather may affect coffee prices
Rainy weather in Vietnam may damage the robusta coffee crop. Will the coffee prices grow?
The storm in the Central Highlands of Vietnam contributes to the dreg increase, which hinders the cleaning and drying of coffee beans. According to the MDA Weather Services forecast, weather conditions may also worsen in Brazil, where the arabica coffee grows. Vietnam accounts for about 20% of the world's coffee crop and Brazil - for about another third. Another negative factor for the world coffee market may be the decrease in exports from Honduras by 4.3% and from Costa Rica by 55% in October 2017. The Honduras share of exports in the world coffee market is less than 3%, and about 1.5% of Costa Rica. The main reason for the decline in exports from these countries was the negative impact of tropical storm Nate in the Atlantic Ocean. Weather conditions usually strongly influence the price dynamics of agricultural futures.
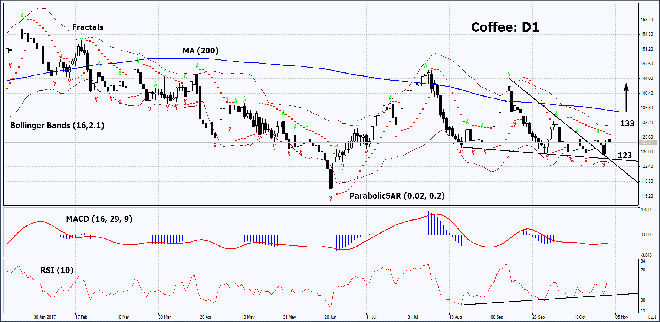
On the daily timeframe, Coffee: D1 is correcting upwards after updating the 4-month low. Further price increase is possible in case of the crop decrease because of continual bad weather conditions and an increase in global demand.
- The Parabolic indicator gives a bearish signal. It can be used as an additional resistance level, which needs to be overcome before opening a Buy position.
- The Bollinger bands have narrowed, which means lower volatility. They are tilted upwards.
- The RSI indicator is at 50. It has formed a positive divergence.
- The MACD indicator gives a bullish signal.
The bullish momentum may develop in case Coffee exceeds the Parabolic signal, the two last fractal highs, as well as the upper Bollinger band at 133. This level may serve as an entry point. The initial stop loss may be placed below the last fractal low, the 4-month low and the lower Bollinger band at 123. After opening the pending order, we shall move the stop to the next fractal low following the Bollinger and Parabolic signals. Thus, we are changing the potential profit/loss to the breakeven point. More risk-averse traders may switch to the 4-hour chart after the trade and place there a stop loss moving it in the direction of the trade. If the price meets the stop level at 123 without reaching the order at 133, we recommend cancelling the position: the market sustains internal changes that were not taken into account.
Summary of technical analysis
| Position | Buy |
| Buy stop | above 133 |
| Stop loss | below 123 |
- Get Certificate

Note:
This overview has an informative and tutorial character and is published for free. All the data, included in the overview, are received from public sources, recognized as more or less reliable. Moreover, there is no guarantee that the indicated information is full and precise. Overviews are not updated. The whole information in each overview, including opinion, indicators, charts and anything else, is provided only for familiarization purposes and is not financial advice or а recommendation. The whole text and its any part, as well as the charts cannot be considered as an offer to make a deal with any asset. IFC Markets and its employees under any circumstances are not liable for any action taken by someone else during or after reading the overview.
