- Analytics
- Technical Analysis
Cotton Technical Analysis - Cotton Trading: 2016-08-26
Lower cotton stock expected
2016-17 global cotton ending stocks are estimated to fall due to lower beginning stocks and production, while US Department of agriculture projects higher domestic output. Will cotton continue rising?
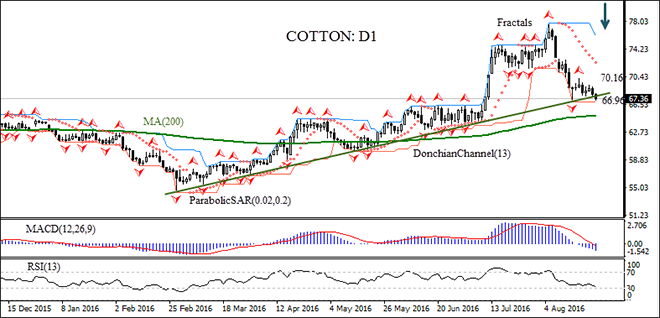
Cotton: D1 has been rising since the end of February on the daily timeframe. The US Department of Agriculture August report World Agricultural Supply and Demand Estimate projects US cotton crop at 15.88 million bales, up 80000 bales from previous month’s estimate. The 2015 output was 12.89 million bales. This was a bearish news for cotton. Notwithstanding higher expected US output, 2016-17 global ending stocks are estimated to fall nearly 2% to 89.61 million bales due to lower beginning stocks and production. Currently the price is falling after hitting a 24 month high on August 5. It is still above the 200-day moving average MA(200), but has breached below the support of the uptrend.
- At the same time the Parabolic indicator gives a buy signal.
- The Donchian channel is tilted down indicating downtrend.
- The RSI oscillator is edging lower and hasn’t reached the oversold zone yet.
- The MACD indicator is below the signal line which is falling, and the gap with the signal line is widening. This is also a bearish signal.
We believe the bearish momentum will continue after the price closes below the last fractal low and lower Donchian boundary at 66.96. A pending order to sell can be placed below that level. The stop loss can be placed above the last fractal high at 70.16. After placing the order, the stop loss is to be moved every day to the next fractal high, following Parabolic signals. Thus, we are changing the probable profit/loss ratio to the breakeven point. The most risk-averse traders may switch to the 4-hour chart after the trade and place there a stop-loss moving it in the direction of the trade. If the price meets the stop loss level (70.16) without reaching the order(66.96) , we recommend cancelling the position: the market sustains internal changes which were not taken into account.
Technical Analysis Summary
| Position | Sell |
| Sell stop | Below 66.96 |
| Stop loss | Above 70.16 |
- Get Certificate

Note:
This overview has an informative and tutorial character and is published for free. All the data, included in the overview, are received from public sources, recognized as more or less reliable. Moreover, there is no guarantee that the indicated information is full and precise. Overviews are not updated. The whole information in each overview, including opinion, indicators, charts and anything else, is provided only for familiarization purposes and is not financial advice or а recommendation. The whole text and its any part, as well as the charts cannot be considered as an offer to make a deal with any asset. IFC Markets and its employees under any circumstances are not liable for any action taken by someone else during or after reading the overview.
