- Analytics
- Technical Analysis
Cotton Technical Analysis - Cotton Trading: 2017-10-24
Rains in India may damage cotton crop
Rainy weather in India may damage the cotton crop. Will the cotton prices grow?
India produces about one quarter of the world cotton. According to forecasts, the world crop in 2017 will be 127.5 mln tonnes and India will account for 30 mln tonnes. Domestic cotton consumption in India is estimated at 24.5 mln tonnes, exports - 4.5 mln tonnes. The remaining part of the crop is sent to the reserves. In the Indian state of Maharashtra, more than 1 thousand farmers have been poisoned by pesticides, some of them died since the end of September, 2017. This may reduce the use of pesticides in agriculture and become an additional factor in reducing the cotton crop.
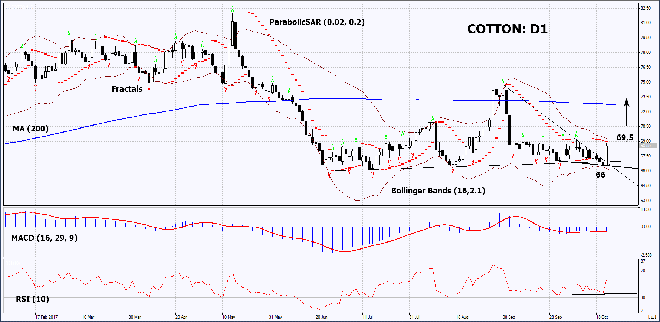
On the daily timeframe, COTTON: D1 repulsed from the support level of the neutral trend. Further price increase is possible in case of the worsening of weather conditions and the decrease of world crop.
- The Parabolic indicator gives a bearish signal. It may be used as an additional resistance level, which needs to be overcome before opening a Buy position.
- The Bollinger bands have markedly narrowed, which means lower volatility.
- The RSI indicator is above 50. It has formed a positive divergence.
- The MACD indicator gives a bullish signal.
The bullish momentum may develop in case COTTON exceeds the Parabolic signal, the upper Bollinger band and the last fractal high at 69.5. This level may serve as an entry point. The initial stop loss may be placed below the lower Bollinger band and the 14-month low at 66. After opening the pending order, we shall move the stop to the next fractal low following the Bollinger and Parabolic signals. Thus, we are changing the potential profit/loss to the breakeven point. More risk-averse traders may switch to the 4-hour chart after the trade and place there a stop loss moving it in the direction of the trade. If the price meets the stop level at 66 without reaching the order at 69.5, we recommend cancelling the position: the market sustains internal changes that were not taken into account.
Summary of technical analysis
| Position | Buy |
| Buy stop | above 69,5 |
| Stop loss | below 66 |
Explore our
Trading Conditions
- Spreads from 0.0 pip
- 30,000+ Trading Instruments
- Stop Out Level - Only 10%
Ready to Trade?
Open Account Note:
This overview has an informative and tutorial character and is published for free. All the data, included in the overview, are received from public sources, recognized as more or less reliable. Moreover, there is no guarantee that the indicated information is full and precise. Overviews are not updated. The whole information in each overview, including opinion, indicators, charts and anything else, is provided only for familiarization purposes and is not financial advice or а recommendation. The whole text and its any part, as well as the charts cannot be considered as an offer to make a deal with any asset. IFC Markets and its employees under any circumstances are not liable for any action taken by someone else during or after reading the overview.
