- Analytics
- Technical Analysis
DE 30 Technical Analysis - DE 30 Trading: 2018-05-10
Rising trade surplus bullish for DE30
German trade surplus and industrial production were better than expected in March. Will the DE 30 index continue gaining?
German economic data were mixed lately: retail sales unexpectedly fell in March, declining 0.6% month-on-month, while consumer inflation remained at 1.6%. German statistics agency reports on Tuesday were positive though with trade balance surplus and industrial production in March increasing more than expected: trade balance surplus grew to 25.2 billion euros from 18.5 billion in February, and industrial production rose 3.2% month over month in March after 2.2% growth in previous month. Rising trade surplus and expanding industrial production are bullish for DE30.
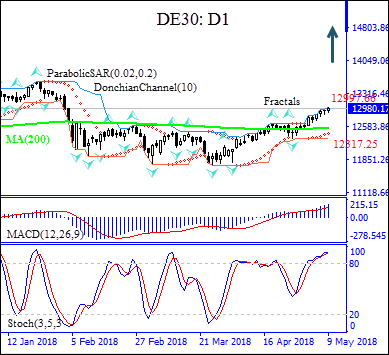
On the daily chart DE30: D1 is retracing after hitting 15-month low in the end of March. It is above the 200-day moving average MA(200).
- The Parabolic indicator has formed a buy signal.
- The Donchian channel gives a neutral signal: it is flat.
- The MACD indicator is above the signal line with the gap widening. This is a bullish signal.
- The stochastic oscillator is in the overbought zone, this is a bearish signal.
We believe the bullish momentum will continue after the price breaches above the upper Donchian boundary at 12997.66. This level can be used as an entry point for placing a pending order to buy. The stop loss can be placed below the lower Donchian boundary at 12317.25. After placing the pending order the stop loss is to be moved every day to the next fractal low, following Parabolic signals. Thus, we are changing the probable profit/loss ratio to the breakeven point. If the price meets the stop-loss level (12317.25) without reaching the order (12997.66) we recommend cancelling the order: the market sustains internal changes which were not taken into account.
Technical Analysis Summary
| Position | Buy |
| Buy Stop | Above 12997.66 |
| Stop loss | Below 12317.25 |
- Get Certificate

Note:
This overview has an informative and tutorial character and is published for free. All the data, included in the overview, are received from public sources, recognized as more or less reliable. Moreover, there is no guarantee that the indicated information is full and precise. Overviews are not updated. The whole information in each overview, including opinion, indicators, charts and anything else, is provided only for familiarization purposes and is not financial advice or а recommendation. The whole text and its any part, as well as the charts cannot be considered as an offer to make a deal with any asset. IFC Markets and its employees under any circumstances are not liable for any action taken by someone else during or after reading the overview.
