- Analytics
- Technical Analysis
EU 50 Index Technical Analysis - EU 50 Index Trading: 2018-07-16
Reporting season of European companies continues
Corporate earnings reports season for the 2nd quarter of 2018 continues in the Eurozone. According to forecasts, the aggregate profit of companies from the Stoxx Europe 50 list will increase by 8%. Will EU50 prices rise?
Market participants hope that Donald Trump’s demands will be limited by the increase of European countries' spending on NATO defense to 2% of GDP and will not touch the issues of mutual trade. In other words, there will be no increase in import duties for European goods following the example of the US-China trade war. Such an opinion may be a positive factor for quotations of companies from the EU. Let us also note that the EU50 dividend yield is 3.6% and it is traded with P/E (capitalization/earnings ratio) of 14.9. This is noticeably better than similar indicators of the US stock index S&P 500: dividend yield 2.4% and P/E 22.2.
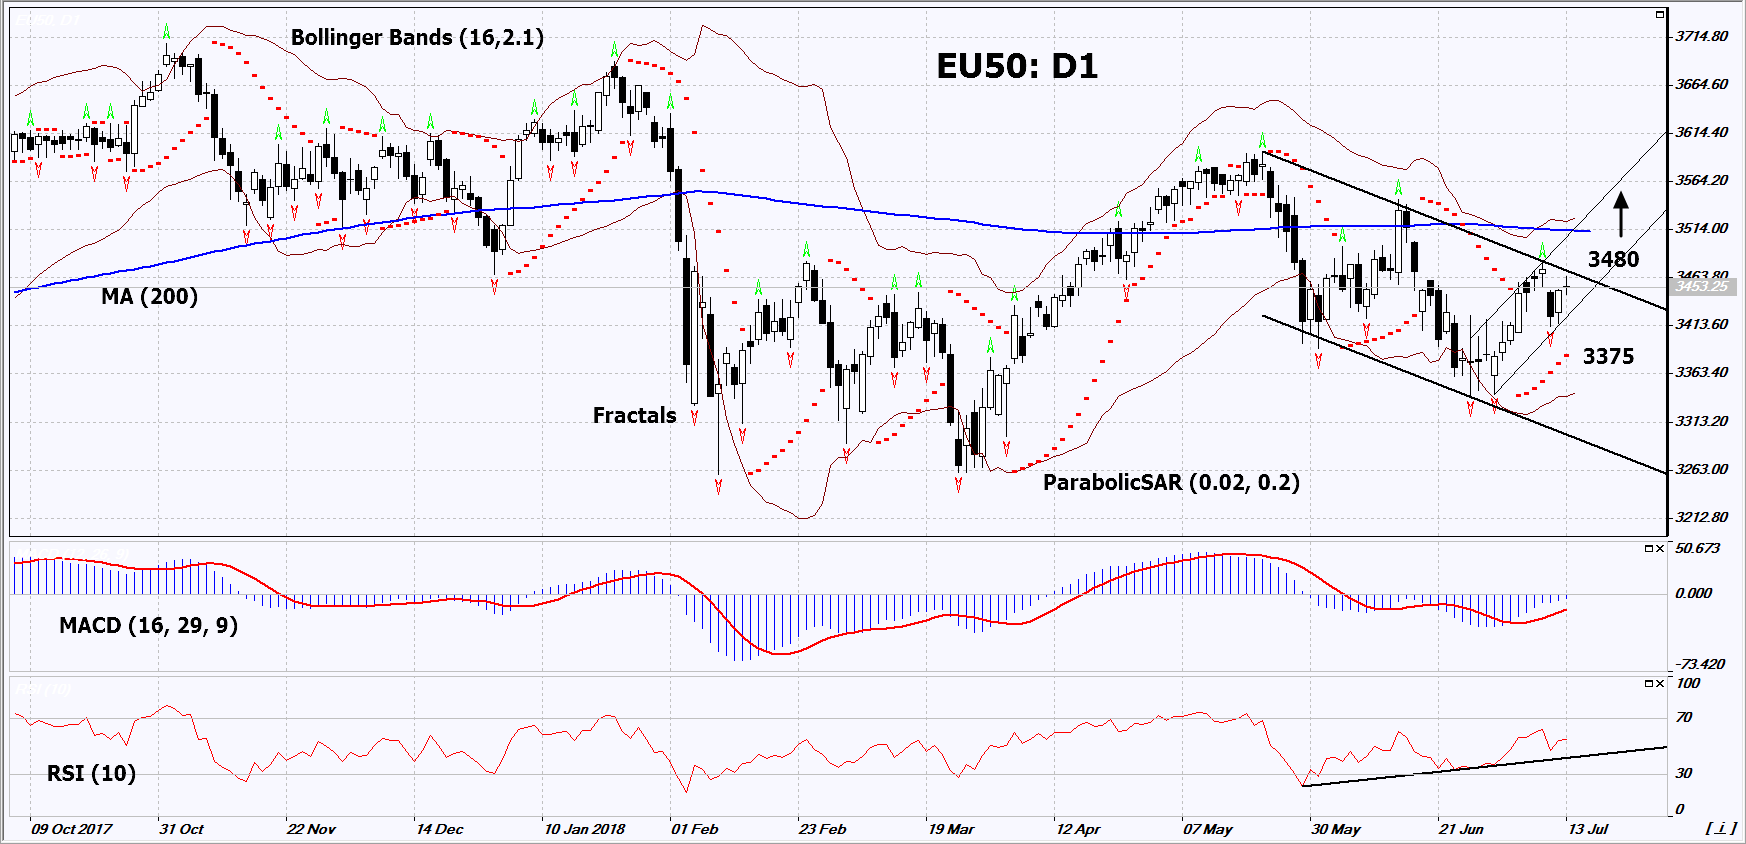
On the daily timeframe, EU50: D1 approached the upper boundary of the falling channel. It should be overcome before opening a buy position. A number of technical analysis indicators formed buy signals. The further price increase is possible in case of the publication of positive reports by the European companies.
- The Parabolic indicator gives a bullish signal.
- The Bollinger bands have widened, which indicates high volatility. They are titled upward.
- The RSI indicator is above 50. It has formed a positive divergence.
- The MACD indicator gives a bullish signal.
The bullish momentum may develop in case EU50 exceeds the last fractal high at 3480. This level may serve as an entry point. The initial stop loss may be placed below the last fractal low and the Parabolic signal at 3375. After opening the pending order, we shall move the stop to the next fractal low following the Bollinger and Parabolic signals. Thus, we are changing the potential profit/loss to the breakeven point. More risk-averse traders may switch to the 4-hour chart after the trade and place there a stop loss moving it in the direction of the trade. If the price meets the stop level (3375) without reaching the order (3480), we recommend to close the position: the market sustains internal changes that were not taken into account.
Summary of technical analysis
| Position | Buy |
| Buy stop | Above 3480 |
| Stop loss | Below 3375 |
- Get Certificate

Note:
This overview has an informative and tutorial character and is published for free. All the data, included in the overview, are received from public sources, recognized as more or less reliable. Moreover, there is no guarantee that the indicated information is full and precise. Overviews are not updated. The whole information in each overview, including opinion, indicators, charts and anything else, is provided only for familiarization purposes and is not financial advice or а recommendation. The whole text and its any part, as well as the charts cannot be considered as an offer to make a deal with any asset. IFC Markets and its employees under any circumstances are not liable for any action taken by someone else during or after reading the overview.
