- Analytics
- Technical Analysis
EUR/USD Technical Analysis - EUR/USD Trading: 2015-02-02
Consolidation
Let’s consider the EUR/USD currency pair on the H4 chart. We continue to keep an eye on euro as ECB announced quantitative easing program. Recall that the ECB regulator will start printing money this March. The planned bond-buying program amounts to 60 billion euro every month. The QE program will last till September 2016, with total purchases surpassing 1 trillion euro. This event is a landmark for long-term investors: the liquidity filling will support exporters, but currently it leads to euro weakening and causes inflation in the euro zone. As a result, the monthly and weekly movements of EUR/USD are still negative: major investors are fretted, and we won’t try to resist the policy of financial institutions, analyzing only sell signals.
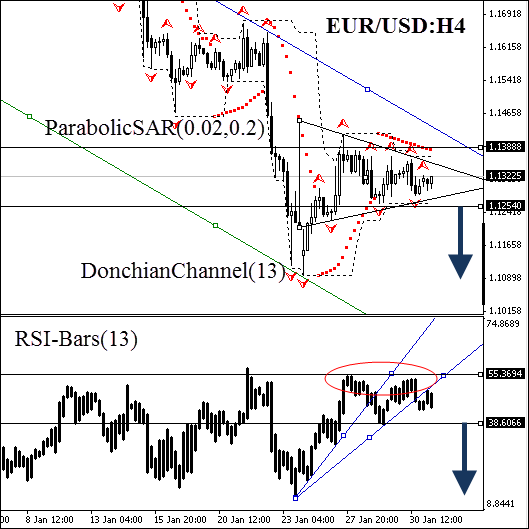
| Position | Sell |
| Sell stop | below 1.12540 |
| Stop loss | above 1.13888 |
Dear traders. For the detailed report of the strategy based on analytical issues of technical analysis click here.
- Get Certificate

Note:
This overview has an informative and tutorial character and is published for free. All the data, included in the overview, are received from public sources, recognized as more or less reliable. Moreover, there is no guarantee that the indicated information is full and precise. Overviews are not updated. The whole information in each overview, including opinion, indicators, charts and anything else, is provided only for familiarization purposes and is not financial advice or а recommendation. The whole text and its any part, as well as the charts cannot be considered as an offer to make a deal with any asset. IFC Markets and its employees under any circumstances are not liable for any action taken by someone else during or after reading the overview.
