- Analytics
- Technical Analysis
EUR/USD Technical Analysis - EUR/USD Trading: 2015-06-15
ECB President speaks today
Today we consider the EUR/USD currency pair on the H4 chart. The price is consolidated between the H4 resistance line and the D1 support line. The market indicates reduced volatility ahead of the Mario Draghi’s speech due today at 15:00 CET. Currently all the technical tools show the bear market on the chart. RSI-Bars oscillator formed a triangle having a bearish bias. ParabolicSAR points move along the H4 bearish trendline. Donchian Channel also reversed in the red zone direction. As the final evidence, we draw your attention to the bearish gap, which was formed at the market opening on Monday (marked in red ellipse). Interbank transactions at the weekend finished with selling EUR/USD ahead of the ECB statement. This can be considered as a fundamental signal.
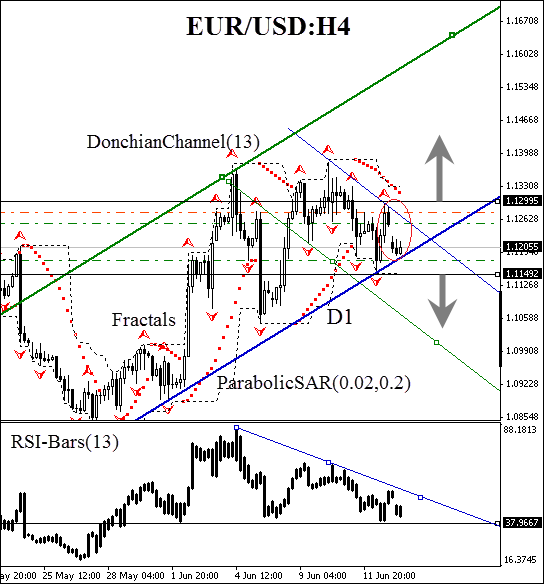
However, the global daily trend is bullish and that is why we won’t rule out the possibility of both scenarios to be developed. We suggest placing two pending orders, Buy at 1.12995 and Sell at 1.11492. Stop loss is to be placed at the opposite side of the price channel. The bearish momentum should be confirmed by the breaking of the oscillator level at 37%. After one of the pending orders is executed, the other one is to be deleted. Stop loss is supposed to be moved every four hours near the next fractal high/low, following Parabolic signals. Thus, we are changing the probable profit/loss ratio to the breakeven point.
| Position | Buy |
| Buy stop | above 1.12995 |
| Stop loss | below 1.11492 |
| Position | Sell |
| Sell stop | below 1.11492 |
| Stop loss | above 1.12995 |
- Get Certificate

Note:
This overview has an informative and tutorial character and is published for free. All the data, included in the overview, are received from public sources, recognized as more or less reliable. Moreover, there is no guarantee that the indicated information is full and precise. Overviews are not updated. The whole information in each overview, including opinion, indicators, charts and anything else, is provided only for familiarization purposes and is not financial advice or а recommendation. The whole text and its any part, as well as the charts cannot be considered as an offer to make a deal with any asset. IFC Markets and its employees under any circumstances are not liable for any action taken by someone else during or after reading the overview.
