- Analytics
- Technical Analysis
GB 100 Index Technical Analysis - GB 100 Index Trading: 2016-01-19
Will sideways market persist?
British FTSE 100 stock market index has verged the support of the neutral channel at 3-year low. The bullish momentum may develop in case the level of support stays as it is. The UK economic indicators look better than in EU. Moreover, the positive RSI divergence has formed which is a technical signal. Will FTSE 100 edge up?
The UK GDP in the 3rd quarter was 2.1% year over year while the unemployment was 5.2%. In EU the same indicators were 1.6% and above 10%. The FTSE 100 may react on the UK GDP growth in 4Q 2015 to be released on January 28. This index is highly irresponsive to the slump in oil prices and weak pound. The energy sector accounts for 14.7% of FTSE 100 and the scarce 1.8% in EURO STOXX 50. Within the last 6 months the British index lost 14% while the STOXX edged 18.5% lower. In theory, the correction in oil prices could have supported FTSE 100.
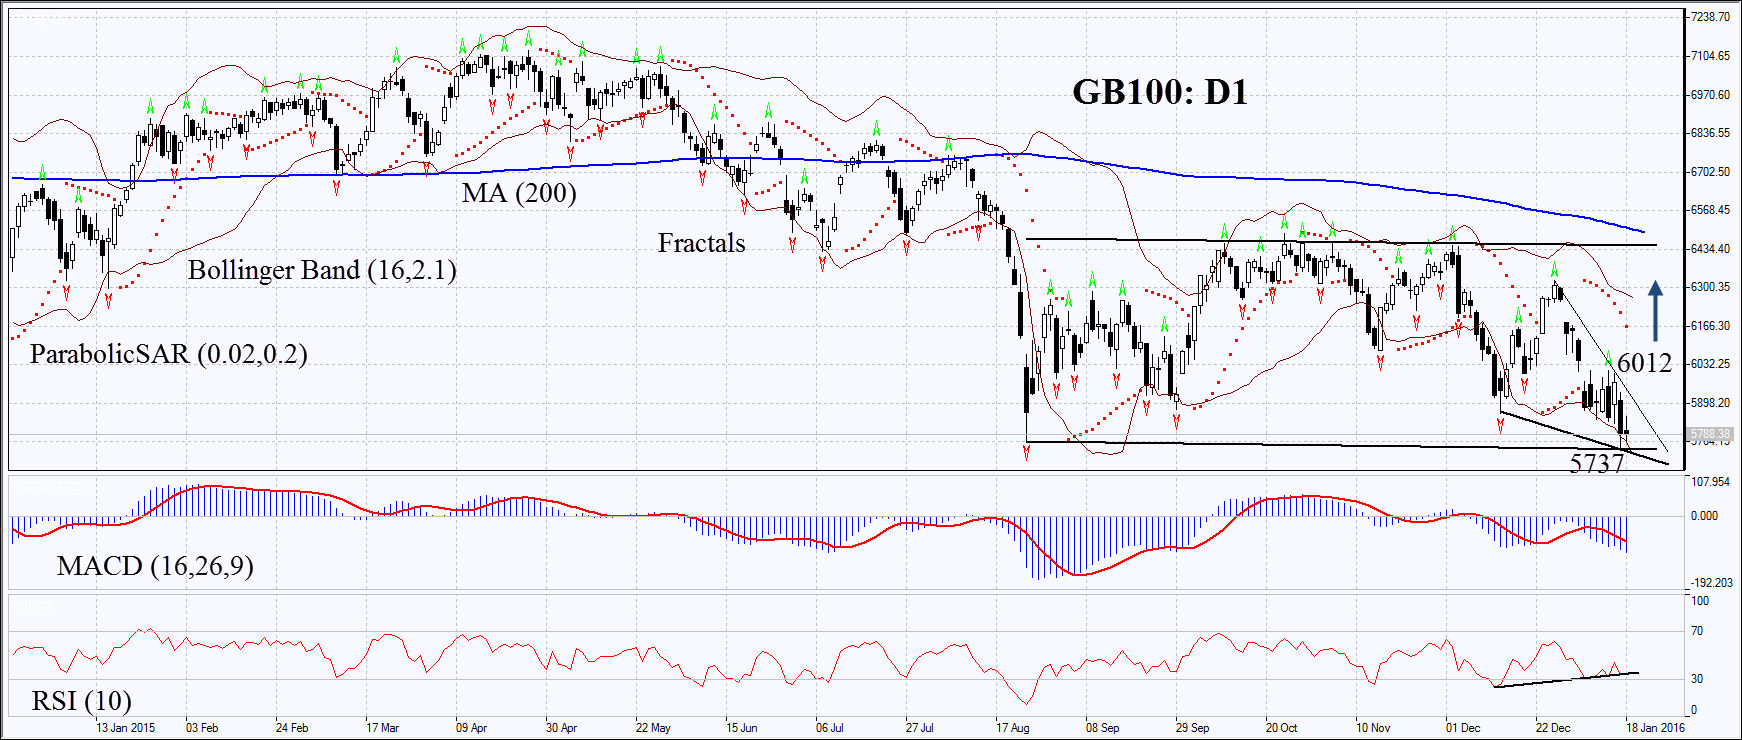
On the daily chart GB100: D1 has reached the lower boundary of the neutral channel but failed to break down through it. The Parabolic and MACD indicators give sell signals. RSI indicator is close to the oversold zone and has formed the positive divergence. The Bollinger bands have widened which may mean high volatility. The bullish momentum may continue in case the UK’s stock index surpasses the last fractal high at 6012. This level may serve the point of entry. The initial risk-limit may be placed below the Parabolic signal and the 3-year low at 5737. Having opened the pending order we shall move the stop to the next fractal low following the Parabolic and Bollinger signals. Thus, we are changing the probable profit/loss ratio to the breakeven point. The most risk-averse traders may switch to the 4-hour chart after the trade and place there a stop-loss moving it in the direction of the trade. If the price meets the stop-loss level at 5737 without reaching the order at 6012, we recommend cancelling the position: the market sustains internal changes which were not taken into account.
| Position | Buy |
| Buy stop | above 6012 |
| Stop loss | below 5737 |
Explore our
Trading Conditions
- Spreads from 0.0 pip
- 30,000+ Trading Instruments
- Stop Out Level - Only 10%
Ready to Trade?
Open Account Note:
This overview has an informative and tutorial character and is published for free. All the data, included in the overview, are received from public sources, recognized as more or less reliable. Moreover, there is no guarantee that the indicated information is full and precise. Overviews are not updated. The whole information in each overview, including opinion, indicators, charts and anything else, is provided only for familiarization purposes and is not financial advice or а recommendation. The whole text and its any part, as well as the charts cannot be considered as an offer to make a deal with any asset. IFC Markets and its employees under any circumstances are not liable for any action taken by someone else during or after reading the overview.
