- Analytics
- Technical Analysis
GBP/USD Technical Analysis - GBP/USD Trading: 2017-05-18
Data support British Pound
UK economy is improving ahead of June UK parliament election. Will the British Pound continue strengthening?
The British Pound is rising amid improved economic data and corporate earnings in euro-zone, UK’s top trading partner. Two third of European companies out of 76% that have reported first-quarter results as of May 16 have beaten analysts' expectations, indicating earnings growth of around 20%. Recent UK inflation data showed consumer prices rose 2.7% on year in April from 2.3% in the previous month, more than the 2.5% expected. The core inflation also accelerated, rising 2.4% on year after 1.8% gain in March. Expectations of a conservative victory in UK parliament elections on June 8 also support Pound: a larger Tory majority is deemed more favorable for Prime Minister May allowing her more flexibility to avoid more extreme outcomes in hard Brexit scenario and accept a long transition period after the formal withdrawal. Today Retail Sales for April will be reported, no change is expected. On May 25 second estimate of Q1 GDP will be published, an improvement is expected.
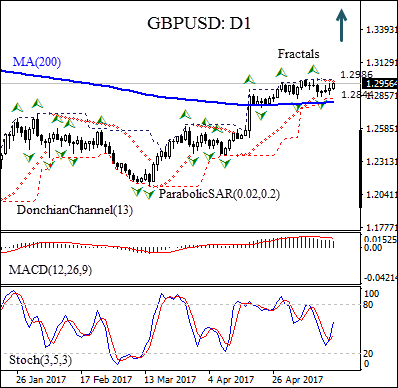
On the daily chart the GBPUSD: D1 is above the 200-day moving average MA(200) which is edging higher after leveling off in the beginning of April.
- The Parabolic indicator gives a sell signal.
- The Donchian channel is flat, indicating no trend yet.
- The MACD indicator gives a bearish signal.
- The stochastic oscillator is rising but has not reached the overbought zone, this is a bullish signal.
We believe the bullish movement will continue after the price breaches above the upper Donchian bound at 1.2986, confirmed also by fractal high. It can be used as an entry point for a pending order to buy. The stop loss can be placed below the last fractal low at 1.2844. After placing the pending order the stop loss is to be moved every day to the next fractal high, following Parabolic signals. Thus, we are changing the probable profit/loss ratio to the breakeven point. If the price meets the stop-loss level (1.2844) without reaching the order (1.2896) we recommend cancelling the position: the market sustains internal changes which were not taken into account.
Technical Analysis Summary
| Position | Buy |
| Buy stop | Above 1.2986 |
| Stop loss | Below 1.2844 |
Explore our
Trading Conditions
- Spreads from 0.0 pip
- 30,000+ Trading Instruments
- Stop Out Level - Only 10%
Ready to Trade?
Open Account Note:
This overview has an informative and tutorial character and is published for free. All the data, included in the overview, are received from public sources, recognized as more or less reliable. Moreover, there is no guarantee that the indicated information is full and precise. Overviews are not updated. The whole information in each overview, including opinion, indicators, charts and anything else, is provided only for familiarization purposes and is not financial advice or а recommendation. The whole text and its any part, as well as the charts cannot be considered as an offer to make a deal with any asset. IFC Markets and its employees under any circumstances are not liable for any action taken by someone else during or after reading the overview.
