- Analytics
- Technical Analysis
HEATING OIL Technical Analysis - HEATING OIL Trading: 2018-01-22
The US is increasing oil production
The International Energy Agency (IEA) forecasts that the US oil production will exceed 10 mln barrels per day in the near future. Will the HEATOIL quotes decrease?
According to the US Department of Energy data for January 12, 2018, the US oil production increased to 9.75 mln barrels per day from 9.5 mln barrels per day a week earlier. Note that the demand for heating oil may decrease as the winter period ends. Another factor in favor of a possible correction of oil quotes may be an ongoing decline in the US inventories. They fell for the 9th time in a row, by 6.9 mln barrels in a week, ending on January 12. Currently, the US inventories are 412.7 mln barrels, which is the lowest since February 2015. Their level has already dropped below the 5-year average, which is equal to 420 mln barrels. Previously, OPEC countries and independent producers announced that after the reduction of inventories to the 5-year average level, it will be possible to cancel the agreement on oil production limitation in the volume of 1.8 mln barrels per day. An important factor preventing the decline in oil quotes was the report on the reduction of oil production in Venezuela to a 29-year low of 1.61 mln barrels per day. According to the IEA, such negative trend may persist. In December 2017, the OPEC oil production amounted to 32.23 mln barrels per day. This is noticeably less than the agreement on production limitation allows. However, the IEA also expects a slowdown in the growth of global oil demand in 2018 to 1.3 mln barrels per day, compared with its growth by 1.6 mln last year.
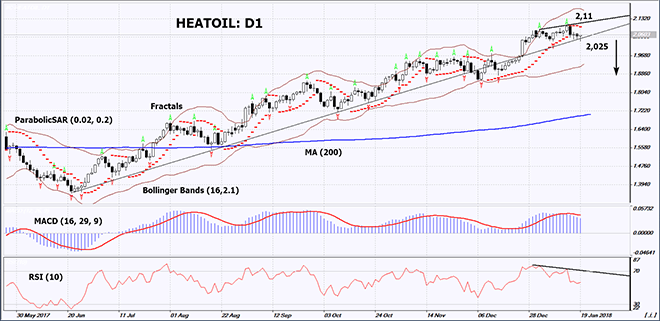
On the daily timeframe, HEATOIL: D1 is decreasing and has approached the support level of the rising trend. A downward correction is possible in case of a decrease in the demand for heating oil and an increase in the total oil production.
- The Parabolic indicator gives a bearish signal.
- The Bollinger bands have widened, which means higher volatility.
- The RSI indicator is above 50. It has formed a negative divergence.
- The MACD indicator gives a bearish signal.
The bearish momentum may develop in case HEATOIL drops below the support line of the rising trend and the previous fractal low at 2.025. This level may serve as an entry point. The initial stop loss may be placed above the last fractal high, the 3-year high and the Parabolic signal at 2.11. After opening the pending order, we shall move the stop to the next fractal high following the Bollinger and Parabolic signals. Thus, we are changing the potential profit/loss to the breakeven point. More risk-averse traders may switch to the 4-hour chart after the trade and place there a stop loss moving it in the direction of the trade. If the price meets the stop level at 2.11 without reaching the order at 2.025, we recommend cancelling the position: the market sustains internal changes that were not taken into account.
Summary of technical analysis
| Position | Sell |
| Sell stop | below 2,025 |
| Stop loss | above 2,11 |
- Get Certificate

Note:
This overview has an informative and tutorial character and is published for free. All the data, included in the overview, are received from public sources, recognized as more or less reliable. Moreover, there is no guarantee that the indicated information is full and precise. Overviews are not updated. The whole information in each overview, including opinion, indicators, charts and anything else, is provided only for familiarization purposes and is not financial advice or а recommendation. The whole text and its any part, as well as the charts cannot be considered as an offer to make a deal with any asset. IFC Markets and its employees under any circumstances are not liable for any action taken by someone else during or after reading the overview.
