- Analytics
- Technical Analysis
Robusta Coffee Technical Analysis - Robusta Coffee Trading: 2018-01-23
World reserves of green coffee dropped to the 5-year low
The US reserves of green coffee fell to the 3-year low in December 2018. Will the ROBUSTA quotes grow?
According to the Green Coffee Association (GCA), the green coffee reserves declined by almost 300 thousand bags (60 kg) in November of 2017. The decline continued in December for the fifth month in a row and amounted to 106 thousand bags more. Currently, the US green coffee reserves are 6.63 mln bags. Note that the European Coffee Federation (ECF) reported a decrease in the European coffee reserves by 5.3% in November. World green coffee reserves dropped to the 5-year low of 29.3 mln bags at the end of the last year. The main reason for this was the weak coffee crop in Brazil because of the drought in 2017. The crop was only 45 mln bags. This year the coffee crop is expected to grow to 54.5-58.5 mln bags. Of these, Robusta coffee crop may amount to about 13 mln bags, compared to 10.7 mln in 2017. Coffee quotes may strongly depend on weather. Note that Arabica coffee is by more than 1.5 times more expensive than Robusta coffee. Theoretically, the convergence of their prices may increase Robusta coffee quotes.
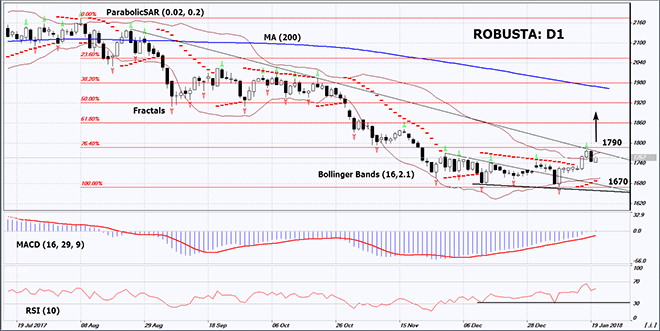
On the daily timeframe, ROBUSTA: D1 is near the resistance line of the downtrend. Before opening a Buy position, it has to be overcome. The further price increase is possible in case of bad weather in Brazil and Vietnam, as well as in case of the closing in of Arabica and Robusta coffee prices.
- The Parabolic indicator gives a bullish signal.
- The Bollinger bands are narrowing, which means lower volatility. They are tilted upwards.
- The RSI indicator is above 50. It has formed a positive divergence.
- The MACD indicator gives a bullish signal.
The bullish momentum may develop in case ROBUSTA exceeds the last fractal high, the resistance line of the downtrend and the upper Bollinger band at 1790. This level may serve as an entry point. The initial stop loss may be placed below the Parabolic signal, the last fractal low, the 1.5-year low and the lower Bollinger band at 1670. After opening the pending order, we shall move the stop to the next fractal low following the Bollinger and Parabolic signals. Thus, we are changing the potential profit/loss to the breakeven point. More risk-averse traders may switch to the 4-hour chart after the trade and place there a stop loss moving it in the direction of the trade. If the price meets the stop level at 1670 without reaching the order at 1790, we recommend cancelling the position: the market sustains internal changes that were not taken into account.
Summary of technical analysis
| Position | Buy |
| Buy stop | above 1790 |
| Stop loss | below 1670 |
- Get Certificate

Note:
This overview has an informative and tutorial character and is published for free. All the data, included in the overview, are received from public sources, recognized as more or less reliable. Moreover, there is no guarantee that the indicated information is full and precise. Overviews are not updated. The whole information in each overview, including opinion, indicators, charts and anything else, is provided only for familiarization purposes and is not financial advice or а recommendation. The whole text and its any part, as well as the charts cannot be considered as an offer to make a deal with any asset. IFC Markets and its employees under any circumstances are not liable for any action taken by someone else during or after reading the overview.
