- Analytics
- Technical Analysis
Soybean Trade Technical Analysis - Soybean Trade Trading: 2017-03-10
Increased supply is bearish for soybean
Dry weather in Brazil allowed to end the backlog of trucks on amazon road between soy fields and northern ports. And high soybeans price relative to corn makes soybeans more attractive for planting for US farmers. Will soybean prices continue the decline?
Dry weather in Brazil improved condition on unpaved Amazon road allowing the Army to free thousands of trucks carrying 30-40 tons of soybeans each, ending the backlog of trucks on the road between soy fields and northern ports. Brazil is world's largest soybean exporter, and is in final stages of a record harvest of more than 100 million tonnes. Resumption of stalled soybeans delivery via northern Brazil route is bearish for soybeans. At the same time high soybean price ratio relative to corn encourages more soybeans production. A ratio above 2.5 is seen as a strong signal to start planting soybeans as it offers higher returns. Currently the ratio between November soybean futures to December corn futures in Chicago is at about 2.57. Expected higher plantings is also bearish for soybeans prices.
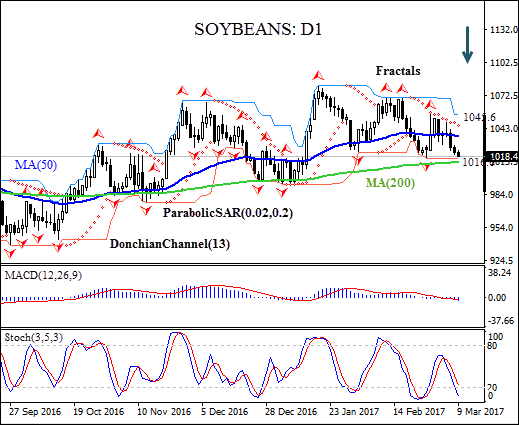
On the daily timeframe SOYBEAN: D1 has been trading with negative bias after retracing to five-month high in mid-January. The price has fallen below the 50-day moving average MA(50).
- The Donchian channel is tilted downward indicating downtrend.
- The Parabolic indicator has formed a sell signal.
- The MACD indicator gives a sell signal.
- The stochastic oscillator is falling and has crossed into an oversold zone.
We believe the bearish momentum will continue after the price closes below the lower boundary of Donchian channel at 1016.6, confirmed also by the last fractal low. This level can be used as an entry point for placing a pending order to sell. The stop loss can be placed above the Parabolic signal at 1045.6. After placing the order, the stop loss is to be moved every day to the next fractal high, following Parabolic signals. Thus, we are changing the probable profit/loss ratio to the breakeven point. If the price meets the stop loss level (1045.6) without reaching the order (1016.6), we recommend cancelling the position: the market has undergone internal changes which were not taken into account.
Technical Analysis Summary
| Position | Sell |
| Sell stop | Below 1016.6 |
| Stop loss | Above 1045.6 |
Explore our
Trading Conditions
- Spreads from 0.0 pip
- 30,000+ Trading Instruments
- Stop Out Level - Only 10%
Ready to Trade?
Open Account Note:
This overview has an informative and tutorial character and is published for free. All the data, included in the overview, are received from public sources, recognized as more or less reliable. Moreover, there is no guarantee that the indicated information is full and precise. Overviews are not updated. The whole information in each overview, including opinion, indicators, charts and anything else, is provided only for familiarization purposes and is not financial advice or а recommendation. The whole text and its any part, as well as the charts cannot be considered as an offer to make a deal with any asset. IFC Markets and its employees under any circumstances are not liable for any action taken by someone else during or after reading the overview.
