- Analytics
- Technical Analysis
Soybean Trade Technical Analysis - Soybean Trade Trading: 2017-06-01
Lower Chinese import demand is bearish for soybean prices
China’s soybean importers are delaying soybean shipment orders. Will soybean prices continue the decline?
Last week hedge funds raised their net short position in soybean futures by nearly 26000 lots to 62355 contracts, according to data from the US Commodity Futures Trading Commission. This is the largest net short in 14 months. At the same time Chinese soybean importers are pushing to postpone or cancel cargoes as they incur hefty losses processing the beans into cooking oil and animal feed ingredients. Losses are rising as prices for soybean oil fall due to the flooding of China’s edible oil market with rapeseed oil auctioned from national reserves and by growing imports of other alternative vegetable oils. Falling Chinese demand for soybean imports are also bearish for soybean.
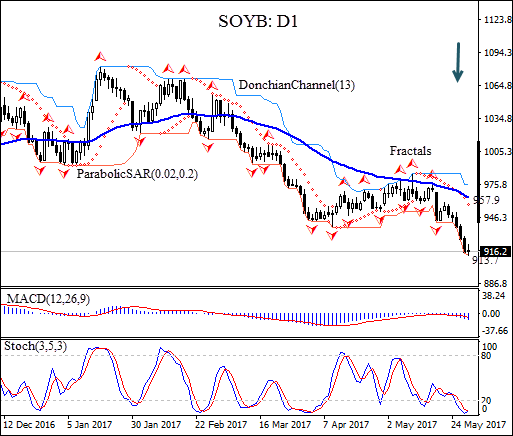
On the daily timeframe SOYBEAN: D1 has been trading with negative bias after retracing to two-month high in mid-May. The price is below the 50-day moving average MA(50).
- The Donchian channel is tilted downward indicating downtrend.
- The Parabolic indicator has formed a sell signal.
- The MACD indicator is bearish.
- The stochastic oscillator is rising from the oversold zone, this is a bullish signal.
We believe the bearish momentum will continue after the price closes below lower boundary of Donchian channel at 913.7. This level can be used as an entry point for placing a pending order to sell. The stop loss can be placed above the Parabolic signal at 957.9. After placing the order, the stop loss is to be moved every day to the next fractal high, following Parabolic signals. Thus, we are changing the probable profit/loss ratio to the breakeven point. If the price meets the stop loss level (957.9) without reaching the order (913.7), we recommend cancelling the position: the market has undergone internal changes which were not taken into account.
Technical Analysis Summary
| Position | Sell |
| Sell stop | Below 913.7 |
| Stop loss | Above 957.9 |
Explore our
Trading Conditions
- Spreads from 0.0 pip
- 30,000+ Trading Instruments
- Stop Out Level - Only 10%
Ready to Trade?
Open Account Note:
This overview has an informative and tutorial character and is published for free. All the data, included in the overview, are received from public sources, recognized as more or less reliable. Moreover, there is no guarantee that the indicated information is full and precise. Overviews are not updated. The whole information in each overview, including opinion, indicators, charts and anything else, is provided only for familiarization purposes and is not financial advice or а recommendation. The whole text and its any part, as well as the charts cannot be considered as an offer to make a deal with any asset. IFC Markets and its employees under any circumstances are not liable for any action taken by someone else during or after reading the overview.
