- Analytics
- Technical Analysis
USD/CAD Technical Analysis - USD/CAD Trading: 2015-05-08
Anticipating labor market reports
Let us consider USDCAD, one of major commodity currencies. In January 2015 the Bank of Canada cut the overnight target rate from 1% to 0.75%. At following meetings in March and recently on April 15 it left the interest rates at the same level. The central bank also revised downward its 2015 GDP forecast to 1.9 % from a previous estimate of 2.1 %. At the same time the Bank of Canada expects stronger US and global growth will combine to create higher demand for non-energy exports, offsetting the fall in energy exports and boosting investment. Recent data indicated the GDP in February remained unchanged after 0.2% decline in January while the consumer prices index in Canada increased 1.2% year-on-year in March from 1% in the previous month, and unemployment stayed stable at 6.8%. At the same time the trade deficit in March widened to CAD 3.02 billion from CAD 2.22 billion in February. On Friday labor market data will be reported, which will provide a boost to volatility. The unemployment rate is expected to rise in April to 6.9%, which will negatively affect the Canadian currency. Simultaneously the closely watched US nonfarm payrolls report will be released in US, and expectations are for a gain of 230 thousand jobs in the private sector while the unemployment rate is expected to fall to 5.4% from 5.5% in March. Such a positive development is certain to strengthen the US dollar against major currencies, pushing the USDCAD higher. However, there is a chance that the increase in private sector jobs may fall short of the expected 230 thousand gain in nonfarm payrolls, reinforcing expectations that the Fed will not raise the interest rates until late in the year. In such a scenario the US dollar will not receive a boost against its rivals.
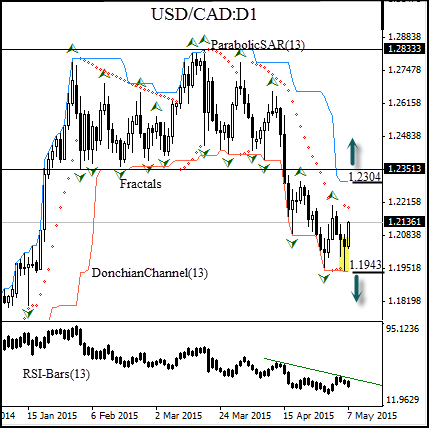
The USDCAD had been trading in a range for over two months with key support and resistance levels at 1.23513 and 1.28333. On April 15 it broke the key support level and closed below it, forming a bearish bias that has continued till the present. The RSI-Bars oscillator indicates downtrend. The retracement that started on April 30 reversed two days later but ended with Hammer candlestick pattern. The Hammer candlestick formation is a bullish reversal pattern that occurs at the bottom of downtrends. The breach of the upper Donchian channel at 1.2304 following a break above the last fractal high at 1.22037 will signify the formation of bullish momentum that will push the pair back into the trading range. We do not exclude also the resumption of the downtrend movement after the current retracement ends and the pair breaches the lower Donchian channel at 1.1943. Let the market choose the price movement scenario. Two pending orders can be placed: when one of them is activated, the other can be canceled, since the market has chosen the direction. After pending order placing, the stop loss is to be moved every day to the next fractal high (short position) or fractal low (long position), following Parabolic signals. Thus, we are changing the probable profit/loss ratio to the breakeven point. If the price meets the stop loss level without reaching the order, we recommend cancelling the position: the market sustains internal changes which were not considered.
| Position | Buy |
| Buy stop | above 1.2304 |
| Stop loss | below 1.1943 |
| Position | Sell |
| Sell stop | below 1.1943 |
| Stop loss | above 1.2304 |
- Get Certificate

Note:
This overview has an informative and tutorial character and is published for free. All the data, included in the overview, are received from public sources, recognized as more or less reliable. Moreover, there is no guarantee that the indicated information is full and precise. Overviews are not updated. The whole information in each overview, including opinion, indicators, charts and anything else, is provided only for familiarization purposes and is not financial advice or а recommendation. The whole text and its any part, as well as the charts cannot be considered as an offer to make a deal with any asset. IFC Markets and its employees under any circumstances are not liable for any action taken by someone else during or after reading the overview.
