- Analytics
- Technical Analysis
Silver AUD Technical Analysis - Silver AUD Trading: 2019-12-24
Silver prices rise amid US-China talks
In this review, we suggest considering the personal composite instrument (PCI) «XAGAUD». It reflects the price dynamics of silver against the Australian dollar. Is there a possibility for the XAGAUD to rise?
Such dynamics are observed in case of an increase in silver prices and the weakening of the Australian dollar. Particularly important information before Christmas and New Year holidays is not expected. Significant macroeconomic data in Australia will be released only on January 9, 2020 - the trade balance for November. The meeting of the Reserve Bank of Australia will be held on February 4, 2020. US-China trade talks progress may affect the dynamics of the Australian dollar. China buys a significant portion of Australian raw materials. Precious metals prices also depend on the success of negotiations between the United States and China. In November, Chinese GDP grew by 6% year over year, which has been the smallest increase over the past 30 years. Some investors consider precious metals, including silver, as safe-haven assets in case of risks of a slowdown in the global economy.
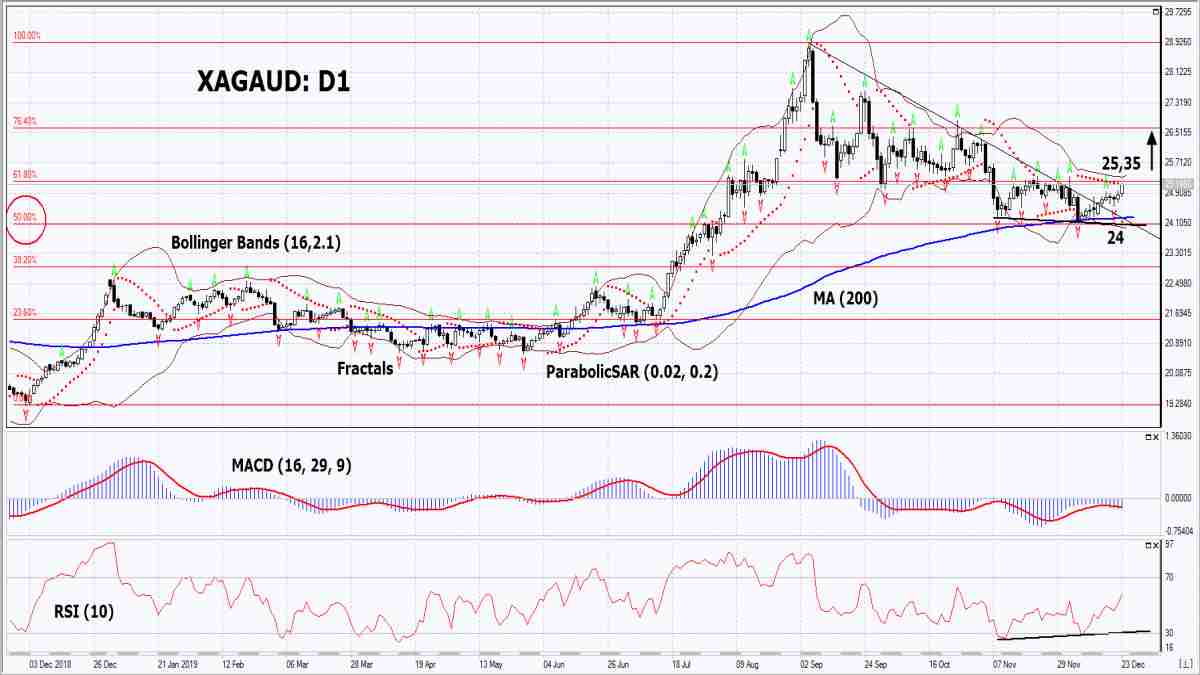
On the daily timeframe, XAGAUD: D1 breached up the resistance line of the downtrend. Before that, it bounced from the 50% Fibonacci retracement level and the 200-day moving average line. A number of technical analysis indicators formed buy signals. The further price increase is possible in case of high demand for silver and the weakening Australian dollar.
- The Parabolic indicator gives a bullish signal.
- The Bollinger bands have narrowed, which indicates low volatility. The upper Bollinger band is titled upward.
- The RSI indicator is above 50. It has formed a positive divergence.
- The MACD indicator gives a bullish signal.
The bullish momentum may develop in case XAGAUD exceeds the two last fractal highs and the upper Bollinger band at 25.35. This level may serve as an entry point. The initial stop loss may be placed below the 200-day moving average line, the Parabolic signal, the 2 last fractal lows and the lower Bollinger band at 24. After opening the pending order, we shall move the stop to the next fractal low following the Bollinger and Parabolic signals. Thus, we are changing the potential profit/loss to the breakeven point. More risk-averse traders may switch to the 4-hour chart after the trade and place there a stop loss moving it in the direction of the trade. If the price meets the stop level (24) without reaching the order (25.35), we recommend closing the position: the market sustains internal changes that were not taken into account.
Summary of technical analysis
| Position | Buy |
| Buy stop | Above 25.35 |
| Stop loss | Below 24 |
Explore our
Trading Conditions
- Spreads from 0.0 pip
- 30,000+ Trading Instruments
- Stop Out Level - Only 10%
Ready to Trade?
Open Account Note:
This overview has an informative and tutorial character and is published for free. All the data, included in the overview, are received from public sources, recognized as more or less reliable. Moreover, there is no guarantee that the indicated information is full and precise. Overviews are not updated. The whole information in each overview, including opinion, indicators, charts and anything else, is provided only for familiarization purposes and is not financial advice or а recommendation. The whole text and its any part, as well as the charts cannot be considered as an offer to make a deal with any asset. IFC Markets and its employees under any circumstances are not liable for any action taken by someone else during or after reading the overview.
