- Analytics
- Technical Analysis
Energy Stock Index USA Technical Analysis - Energy Stock Index USA Trading: 2016-09-12
Energy stocks follow oil's lead
Energy stocks rise as oil prices recover from multi-year lows. Let’s study the performance of the PCI – Energy stocks index , composed of stocks of world’s biggest energy companies. Will the index rise?
After hitting multi-year low on January 20 oil prices reversed the downtrend that started in 2014. Energy stock prices followed oil’s lead as oil prices started recovering from the losses: since mid-June 2014 Brent crude price has fallen over 57%. Energy stocks rebounded as oil prices started recovering: in the last one year period SP500 energy sector index (ticker SPN) has gained 9.2%. Recently energy prices were buoyed by an agreement between major oil producers Russia and Saudi Arabia to set up a working group to monitor the oil market and come up with recommendations to promote stability. The unexpected drop in US crude stockpiles last week also boosted oil prices: the US crude supplies fell 14.5 million barrels instead of an expected 425000 barrel increase. Another bullish development for energy sector was the trade report from China, showing oil imports in August were the highest since December. While the unexpectedly big draw for US crude stocks can be partly explained by lower output from Gulf of Mexico due to hurricane, consistently high global demand for oil is contributing to balancing of global oil market, supporting prices of energy stocks.
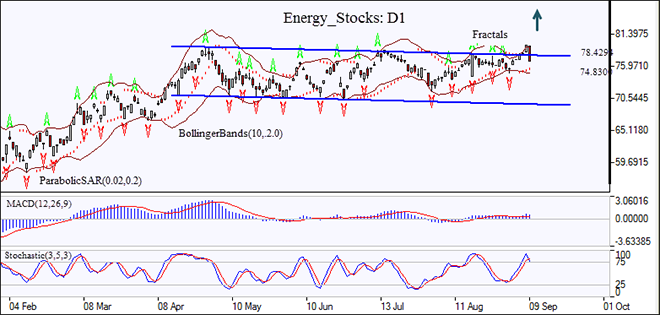
On the daily chart the Energy_Stocks: D1 has been trading in a range with a slight negative bias. The price has breached above the resistance line of the upper channel and is pulling back.
- The Bollinger bands are starting to widen, indicating increasing volatility.
- The Parabolic indicator gives a buy signal.
- The stochastic oscillator is in the overbought zone, which is a bearish signal.
- The MACD indicator is above the signal line and the zero level which is a bullish signal.
We believe the bullish momentum will continue after the price closes above the upper channel at 78.4294. It can serve as an entry point for a pending order to buy. The stop loss can be placed below the last fractal low at 74.8300. After placing the pending order, the stop loss is to be moved to the next fractal low, following Parabolic signals. By doing so, we are changing the probable profit/loss ratio to the breakeven point. The most risk-averse traders may switch to the 4-hour chart after the trade and place there a stop-loss moving it in the direction of the trade. If the price meets the stop loss level (74.8300) without reaching the order, we recommend canceling the position: the market sustains internal changes which were not taken into account.
Technical Analysis Summary
| Position | Buy |
| Buy stop | Above 78.4294 |
| Stop loss | Below 74.8300 |
Explore our
Trading Conditions
- Spreads from 0.0 pip
- 30,000+ Trading Instruments
- Instant Execution
Ready to Trade?
Open Account Note:
This overview has an informative and tutorial character and is published for free. All the data, included in the overview, are received from public sources, recognized as more or less reliable. Moreover, there is no guarantee that the indicated information is full and precise. Overviews are not updated. The whole information in each overview, including opinion, indicators, charts and anything else, is provided only for familiarization purposes and is not financial advice or а recommendation. The whole text and its any part, as well as the charts cannot be considered as an offer to make a deal with any asset. IFC Markets and its employees under any circumstances are not liable for any action taken by someone else during or after reading the overview.
