- Analytics
- Technical Analysis
Natural Gas vs Oil Technical Analysis - Natural Gas vs Oil Trading: 2018-01-24
The demand for natural gas has increased in the US because of cold weather
In this review, we suggest considering the personal composite instrument (PCI) &GAS/OIL. It reflects the dynamics of the price change of the US natural gas against the US light crude oil West Texas Intermediate (WTI). Will the GAS/OIL quotes grow?
The prices of natural gas and oil in the US have positive correlation. Therefore, the GAS/OIL chart tends toward its long-term, 200-day moving average line, or, in other words, it periodically returns to it. This PCI increases when natural gas increases in price faster than oil. Currently, it is contributed by the cold, winter weather in the US, since natural gas is widely used for heating. According to forecasts, next week natural gas consumption will increase to 102.7 bln cubic feet per day, compared to 100.5 bln cubic feet per day this week. The price growth may also be supported by an increase in the exports of the US liquefied natural gas to 9.3 bln cubic feet per day this week, which is by 9% more than in the last year. Last week, gas consumers purchased 249 bln cubic feet from the US gas storage. This is the highest weekly volume since 1997. Currently, the total gas volume in the US storage facilities is by 16% below the 5-year average and is at the low since 2005. At present, it is 2.335 trln cu. feet. In its turn, WTI oil may correct down if Brent crude oil is not able to settle above the psychological level of $70 per barrel.
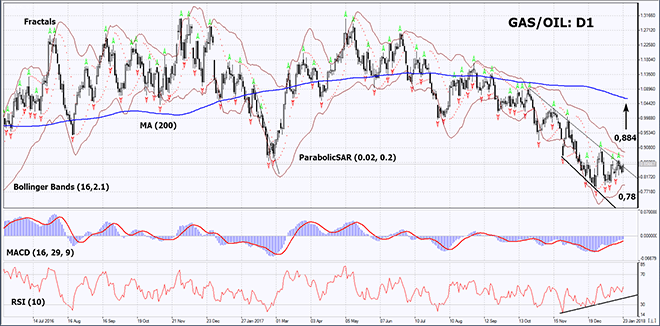
On the daily timeframe, GAS/OIL: D1 has approached the upper border of the downtrend. It has to be exceeded to open a Buy position. The further price increase is possible in case of continual cold weather in the US and a slowdown in the growth of oil prices.
- The Parabolic indicator gives a bearish signal. It may be used as an additional resistance level, which needs to be overcome to open a Buy position.
- The Bollinger bands have narrowed, which means lower volatility.
- The RSI indicator is above 50. It has formed a positive divergence.
- MACD indicator gives a bullish signal.
The bullish momentum may develop in case GAS/OIL exceeds the last fractal high, the Parabolic signal and the resistance line of the downtrend at 0.884. This level may serve as an entry point. The initial stop loss may be placed below the last four fractal lows, the lower Bollinger band and the 1.5-year low at 0.78. After opening the pending order, we shall move the stop to the next fractal low following the Bollinger and Parabolic signals. Thus, we are changing the potential profit/loss to the breakeven point. More risk-averse traders may switch to the 4-hour chart after the trade and place there a stop loss moving it in the direction of the trade. If the price meets the stop level at 0.78 without reaching the order at 0.884, we recommend cancelling the position: the market sustains internal changes that were not taken into account.
Summary of technical analysis
| Position | Buy |
| Buy stop | above 0,884 |
| Stop loss | below 0,78 |
Explore our
Trading Conditions
- Spreads from 0.0 pip
- 30,000+ Trading Instruments
- Instant Execution
Ready to Trade?
Open Account Note:
This overview has an informative and tutorial character and is published for free. All the data, included in the overview, are received from public sources, recognized as more or less reliable. Moreover, there is no guarantee that the indicated information is full and precise. Overviews are not updated. The whole information in each overview, including opinion, indicators, charts and anything else, is provided only for familiarization purposes and is not financial advice or а recommendation. The whole text and its any part, as well as the charts cannot be considered as an offer to make a deal with any asset. IFC Markets and its employees under any circumstances are not liable for any action taken by someone else during or after reading the overview.
