- Analytics
- Technical Analysis
Nasdaq 100 Technical Analysis - Nasdaq 100 Trading: 2016-08-04
Nasdaq index stock valuations are very high
On Monday the US high-tech stock index Nasdaq 100 updated its historical high in spite of the weak US GDP data for the second quarter. On Tuesday, the weak data on consumer spending came out and the index slightly declined. Will the US stock market correction happen?
The valuations of stocks of the US high-tech companies are much higher than the ones of the traditional economy corporations. The Р/Е ratio (current share price/earnings per share) for Nasdaq 100 index is 23. For the S&P 500 it is lower: 19,8. As a result, for instance, the online store Amazon equalled the oil giant Exxon Mobil in capitalization. The P/E ratio of Amazon reached 195, while for Exxon Mobil it is significantly lower: 29. It is difficult to say how justified are the high valuations of high-tech companies. Currently 353 corporations from S&P 500 components have reported earnings for the second quarter. On the basis of these data investors forecast a reduction of the total earnings of S&P 500 components by 2,6%. Market participants are now waiting for the release of labor market data for July on Friday. We do not exclude they may be negative despite the small increase in employment in the US based on the report of the independent agency ADP, published on Wednesday.
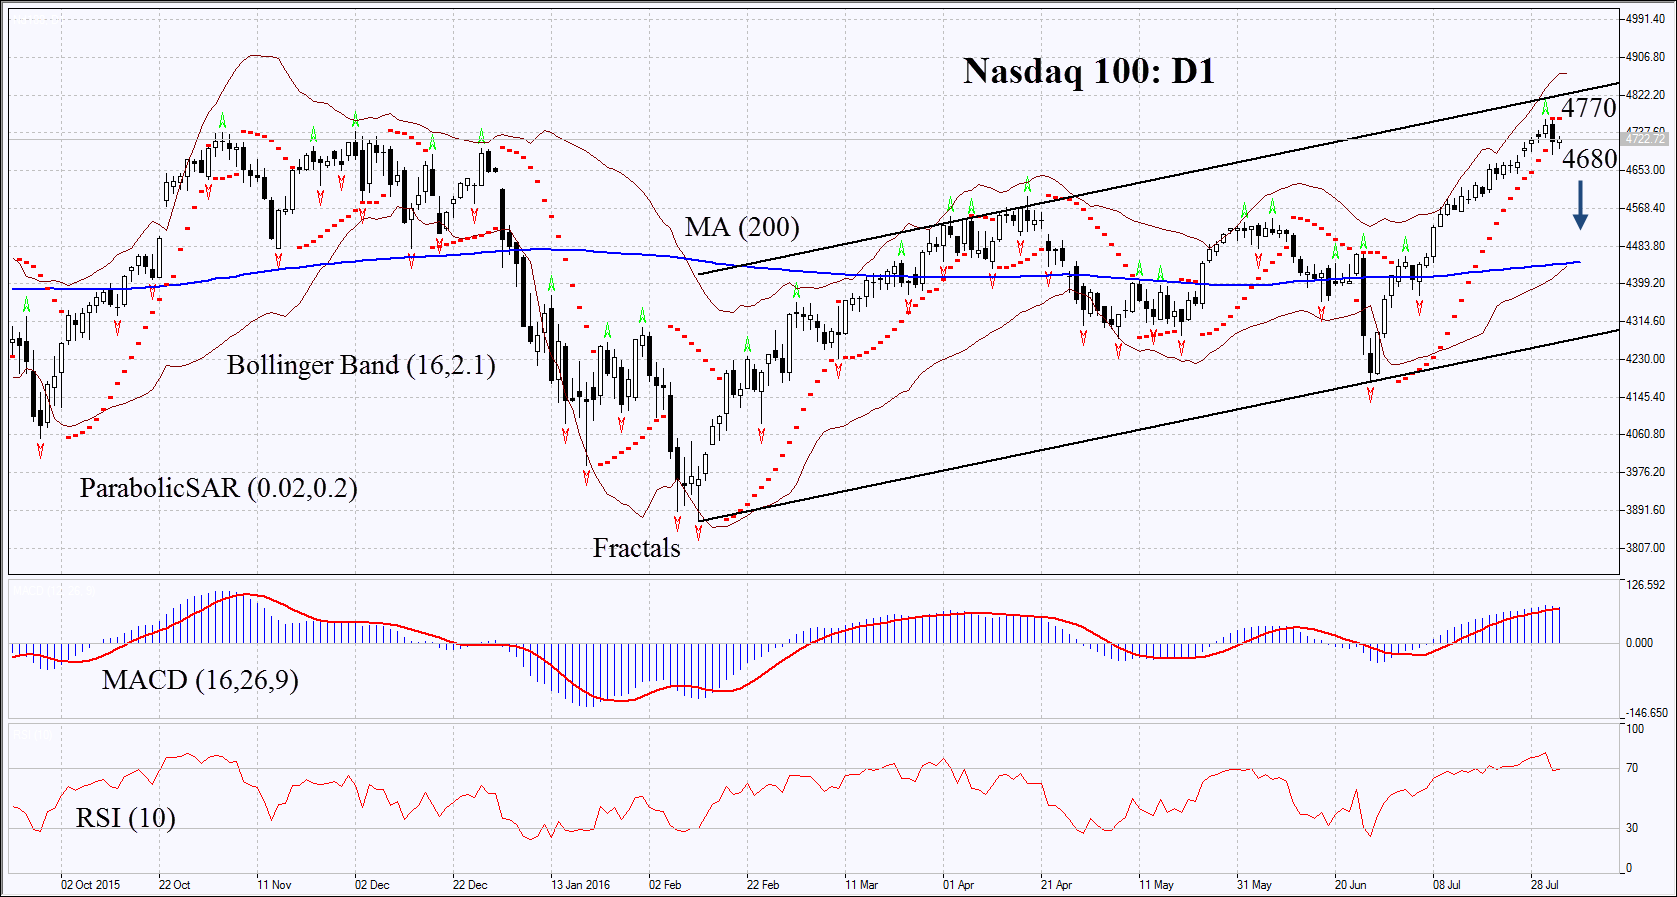
On the daily chart Nasdaq 100: D1 is inching lower from the upper bound of the uptrend. The MACD and Parabolic indicators have formed the signal to sell. The Bollinger bands have widened a lot which means higher volatility. The RSI indicator is in the overbought zone. No divergence. The bearish momentum may develop in case Nasdaq 100 index falls below Tuesday low: 4680. This level may serve as a point of entry. The initial stop-loss may be placed above the historical high, the last fractal high, as well as the Parabolic signal: 4770. After opening the pending order, we shall move the stop to the next fractal high following the Bollinger and Parabolic signals. Thus, we are changing the probable profit/loss ratio to the breakeven point. The most risk-averse traders may switch to the 4-hour chart after the trade and place there a stop-loss moving it in the direction of the trade. If the price meets the stop-loss level at 4770, without reaching the order at 4680, we recommend cancelling the position: the market sustains internal changes which were not taken into account.
| Position | Sell |
| Sell stop | below 4680 |
| Stop loss | above 4770 |
Explore our
Trading Conditions
- Spreads from 0.0 pip
- 30,000+ Trading Instruments
- Stop Out Level - Only 10%
Ready to Trade?
Open Account Note:
This overview has an informative and tutorial character and is published for free. All the data, included in the overview, are received from public sources, recognized as more or less reliable. Moreover, there is no guarantee that the indicated information is full and precise. Overviews are not updated. The whole information in each overview, including opinion, indicators, charts and anything else, is provided only for familiarization purposes and is not financial advice or а recommendation. The whole text and its any part, as well as the charts cannot be considered as an offer to make a deal with any asset. IFC Markets and its employees under any circumstances are not liable for any action taken by someone else during or after reading the overview.
