- Analytics
- Technical Analysis
Soybean Trade Technical Analysis - Soybean Trade Trading: 2016-09-22
More rains forecast is bullish for soybean
Wet weather forecast for key soybean producer states in US for October may result in lost harvest. Increased harvest loss risks are bullish for soybean. Will soybean continue rising?
Wet weather conditions in US Midwest and Plains are likely to continue in October, the main month for US soybean harvest. This increases risks for soybean yield and quality loss, which is bullish for soybean. Moderate rain is expected to continue till the end of September after abundant rains in July and August produced the wettest period in more than 30 years for key producer Illinois as well as Iowa, Minnesota and Indiana. Last week US Climate Prediction Center (CPC) released wet weather forecast for October for western Midwest and Plains. This may result in lower US soybean harvest, just like the loss in recent Argentine harvest. Estimates indicate Argentina, world’s third biggest soybean producer may have lost as much as 4 million tonnes of soybeans harvest due to rains in April, the main harvest month. This amounts to approximately 3.5 % of what the United States expects to harvest this fall.
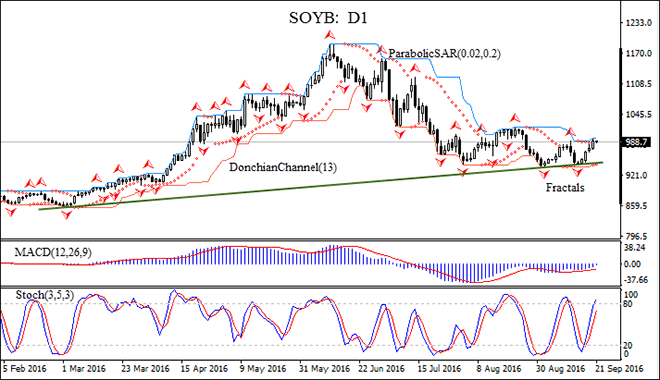
On the daily timeframe SOYB: D1 has been declining after hitting two year high in mid-June.
- The Donchian channel is tilted upward indicating uptrend.
- The Parabolic indicator has formed a buy signal.
- The MACD indicator is below the signal line which is rising and the gap is narrowing, which is a bullish signal.
- The stochastic oscillator is crossing into the overbought zone, which is a bearish sign.
We believe the bullish momentum will continue after the price closes above the upper Donchian channel at 996.5. It can be used as an entry point for placing a pending order to buy. The stop loss can be placed below the last fractal low at 942.9, confirmed also by the lower Donchian channel and Patabolic signal. After placing the order, the stop loss is to be moved every day to the next fractal low, following Parabolic signals. Thus, we are changing the probable profit/loss ratio to the breakeven point. If the price meets the stop loss level (942.9) without reaching the order (996.5), we recommend cancelling the position: the market has undergone internal changes which were not taken into account.
Technical Analysis Summary
| Position | Buy |
| Buy stop | Above 996.5 |
| Stop loss | Below 942.9 |
- Get Certificate

Note:
This overview has an informative and tutorial character and is published for free. All the data, included in the overview, are received from public sources, recognized as more or less reliable. Moreover, there is no guarantee that the indicated information is full and precise. Overviews are not updated. The whole information in each overview, including opinion, indicators, charts and anything else, is provided only for familiarization purposes and is not financial advice or а recommendation. The whole text and its any part, as well as the charts cannot be considered as an offer to make a deal with any asset. IFC Markets and its employees under any circumstances are not liable for any action taken by someone else during or after reading the overview.
